


After upgrading julia to version 1.6.2 (from 1.5.x), it became clear that GR somehow moved on too and changed the internal plotting (see issue 384 and issue 392). This must have happend around GR version 0.57 because none of the versions > 0.57.x or 0.58.x worked for me.
The Problem:
julia> Pkg.add(name="GR", version="0.57.1")
Updating registry at `~/.julia/registries/General`
Resolving package versions...
Installed GR ─ v0.57.1
Updating `~/.julia/environments/v1.6/Project.toml`
[28b8d3ca] + GR v0.57.1
Updating `~/.julia/environments/v1.6/Manifest.toml`
[28b8d3ca] ↓ GR v0.57.2 ⇒ v0.57.1
Building GR → `~/.julia/scratchspaces/44cfe95a-xxx/f74b4xxx/build.log`
Precompiling project...
2 dependencies successfully precompiled in 88 seconds (118 already precompiled, 1 skipped during auto due to previous errors)
julia> Pkg.precompile()
Precompiling project...
✗ GR_jll
0 dependencies successfully precompiled in 4 seconds (120 already precompiled)
julia> ENV["JULIA_GR_PROVIDER"] = "GR" # Do this in a new Julia session
"GR"
julia> import Pkg; Pkg.build("GR")
Building GR → `C:\Users\xxx\.julia\dev\GR\deps\build.log`
julia> using GR
julia> GR.gr_provider # Confirm that the provider is set to GR
Base.RefValue{String}("GR")
The Solution:
julia> versioninfo()
Julia Version 1.6.2
Commit 1b93d53fc4 (2021-07-14 15:36 UTC)
Platform Info:
OS: macOS (x86_64-apple-darwin18.7.0)
CPU: Intel(R) Core(TM)2 Duo CPU P8600 @ 2.40GHz
WORD_SIZE: 64
LIBM: libopenlibm
LLVM: libLLVM-11.0.1 (ORCJIT, penryn)
julia> Pkg.add(name="GR", version="0.55")
Updating registry at `~/.julia/registries/General`
Resolving package versions...
Updating `~/.julia/environments/v1.6/Project.toml`
[28b8d3ca] + GR v0.55.0
Updating `~/.julia/environments/v1.6/Manifest.toml`
[28b8d3ca] ↓ GR v0.57.5 ⇒ v0.55.0
Precompiling project...
✓ GR
✓ Plots
2 dependencies successfully precompiled in 82 seconds (119 already precompiled, 1 skipped during auto due to previous errors)
2 dependencies precompiled but different versions are currently loaded. Restart julia to access the new versions
julia> Pkg.pin(name="GR", version="0.55")
Resolving package versions...
Updating `~/.julia/environments/v1.6/Project.toml`
[28b8d3ca] ~ GR v0.55.0 ⇒ v0.55.0 ⚲
Updating `~/.julia/environments/v1.6/Manifest.toml`
[28b8d3ca] ~ GR v0.55.0 ⇒ v0.55.0 ⚲

Modified Red, Blue, Green and Orange colors to be a little more vibrant.
Install: cd ~ && tar -xzvf ~/Downloads/ATOM_one-dark-pro-vivid-syntax_mod.tar.gz
Based on: https://github.com/zoharxero/one-dark-pro-vivid-syntaxand https://atom.io/themes/one-dark-syntax
Examples:
Python & C:
|
Go: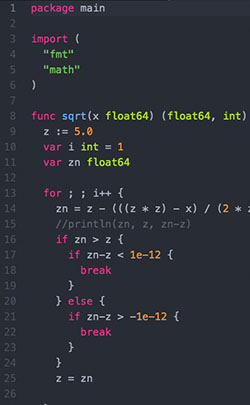
|
Ruby: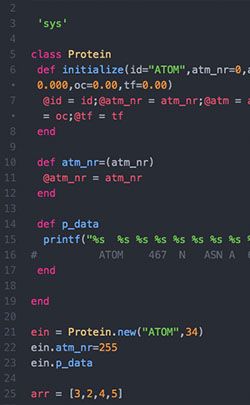
|
R: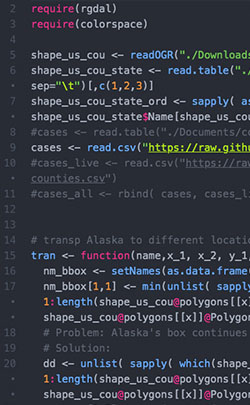
|
Html: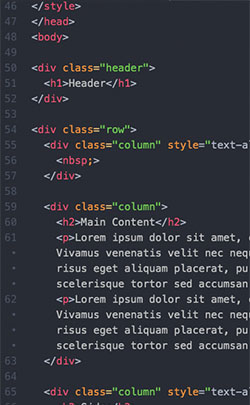
|
Julia: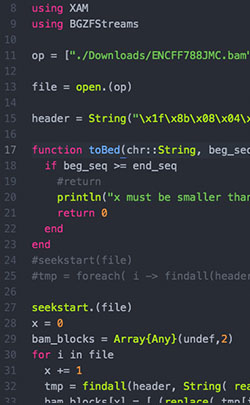
|
Some background here...
I had a gap to fill... I was trapped in the infinite meta limbo of high and low level programming. Go too low and you are practically time inefficient, as you try to eg. solve filling your stack in the most efficient way... Super interesting and blazingly fast execution time is the reward, but let's face it here - I am not a hardcore assembly-programmer, though... hopefully sometime.
So, there is that inevitable peek over to the scripting high level world, where things are so much more time efficient when it comes to speed of programming. BUT... that sort of rapid prototyping hits a massive brick wall when your project is successful and you suddenly realize, darn, now I need something that executes faster. So here comes Julia to the rescue. Sort of.
Through my experience with R, I am kind of spoiled. For every mathematical / statistical problem there's an R package and a way to plot it. Especially R's plotting capabilities are just wonderful. You want to change some plot behavior, R has a solution.
Since Julia is a much younger project, you probably can't expect the same solid flow. I was pretty dissappointed at first when I, while exited about mostly anything else around Julia (DataFrames, 2D arrays aka matrices, the way you can subset arrays, conditional array comprehension, 1-based Arrays, Type-System, speed, workflow etc. etc.), tried plotting my first heatmap.
Reminder coming from R, where gplots provides heatmap.2, you pretty much have the best heatmapping you can possibly dream of; hclustering, legend-formatting, color coding of clusters... you name it, it's there.
With Plots in Julia, not so much, or so I thought... Latency aside, plotting the daily scatter or histogram is awesome and layout= makes it even better. But there was one crucial feature I was missing in heatmaps; the symbreaks=T, see here. I searched left and right, digged through google and any Julia-doc I could find, but no hint, except one tip that seemed outdated (2014) and involved some weird source code manipulation. Dissappointed I was about to abandon my high-spirited move towards Julia. But I was too impressed with everything else surrounding the language that I gave it try after try and one glory morning (probably night), I found my solution, and here it is.Problem: How to center a heatmap color scheme around ZERO, when it has asymmetric maximum() and minimum() values.
julia> using Plots
julia> d = randn( 10, 10 )*3;
julia> d[1,1] = 16.34; # Put in an extreme
julia> heatmap( d )

julia> heatmap( d, c=cgrad( :bwr ) )

julia> function center( arr )
( ( abs( minimum( arr ) ) - maximum( arr ) ) /
( abs( minimum( arr ) ) + abs( maximum( arr ) ) ) * .5 ) + .5
end
julia> heatmap( d, c=cgrad( :bwr, center(d) ) )

Hope thit helps someone else too, somewhere in their journey with Julia. Its a great tool. Keep at it!
Linux Lubuntu 19.10, Arch Linux, macOS High Sierra 10.13.6, Win 10